Data trends over time
Students create and analyze simple line graphs showing how data changes over time (days, weeks, years).

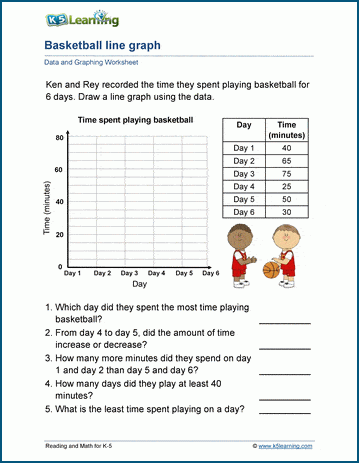
Students create and analyze simple line graphs showing how data changes over time (days, weeks, years).
What is K5?
K5 Learning offers free worksheets, flashcards and inexpensive workbooks for kids in kindergarten to grade 5. Become a member to access additional content and skip ads.